A helpful tip to test fax quality and get an idea of sending time
Telstra Test Fax = 1300 368 909
Telstra have two services for testing fax line quality – TestFax Professional and TestFax Plus. This post mainly covers TestFax Professional.
To get started, send a test fax to TestFax Professional 1300 368 909. The document you send needs to be relatively complex and take more than 70 seconds to transmit, giving the TestFax service time to test the line quality.
Below are some example documents and results:
Test fax 1. Not enough detail
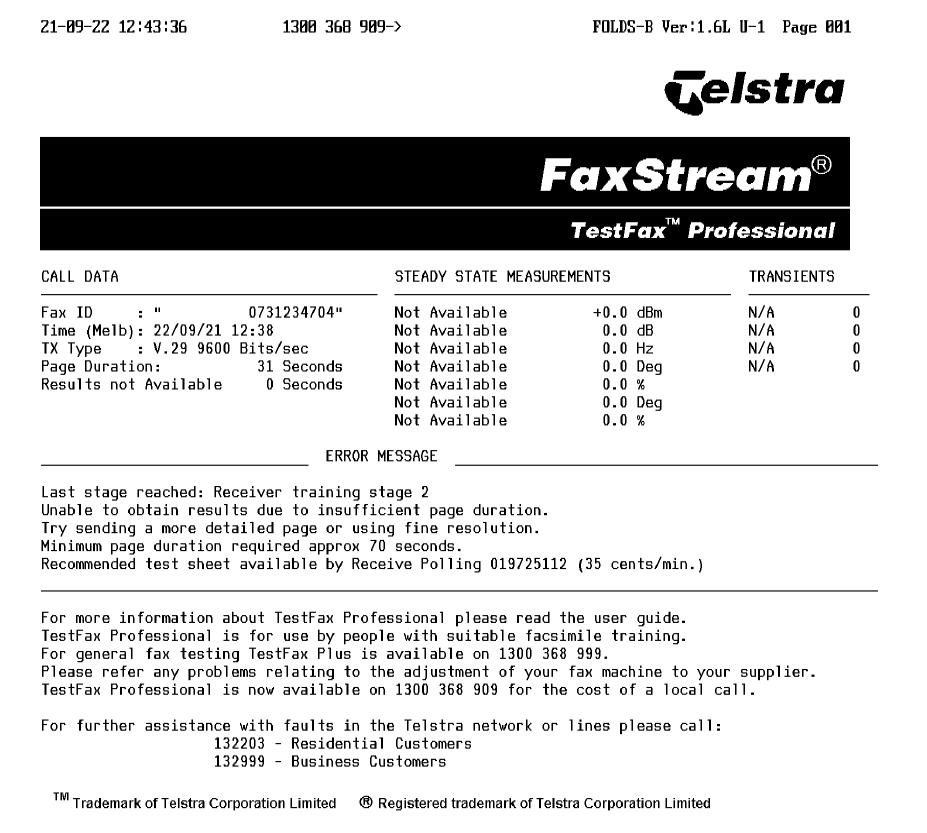
Results 1. Test not completed
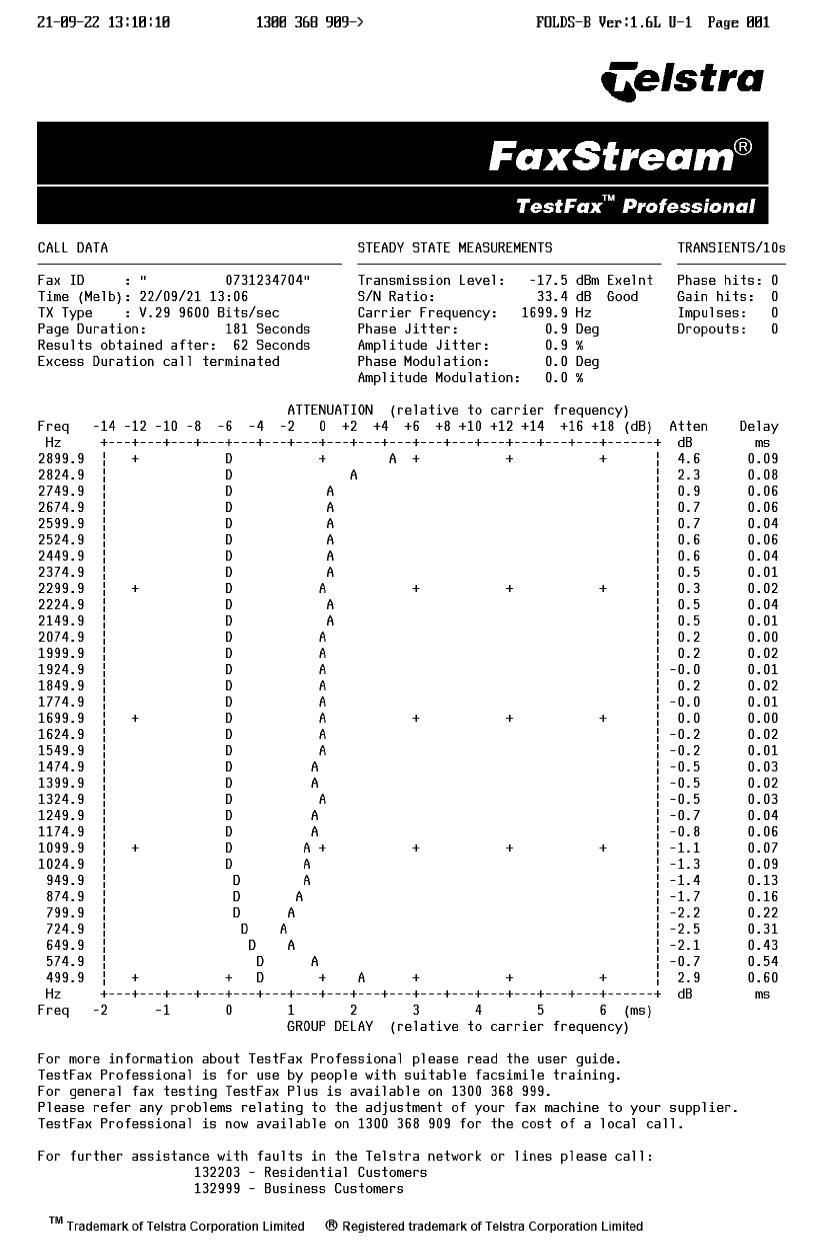
Test fax 2. Good detail level
Results 2. Test complete
Note the test fax with just text and black areas did not provide enough detail, but sending a full-page two tone image did.
Fax ID: Your fax number and company name, if available
Time: The time of transmission;
TX Type: The best available modulation mode. Tx is often used as shorthand for “transmission”.
Page Duration: How long it took to transmit your test fax (this will time out at 180 seconds [3 mins])
Results obtained after: How long it took the service to determine the displayed results.
Steady State Measurements section
Transmission Level: How “loud” your fax transmissions are. A level between -18dB and -16dB is best, but a few dB over or under should be fine. Louder transmissions risk echoing over themselves and corrupting a fax, softer transmissions risk not being heard/received at all.
S/N Ratio: Signal to Noise ratio, or how loud your fax is compared to background noise on the line. Higher numbers (≥40dB) are better.
Transients / 10s
Phase hits: Sudden “phase changes”, indicating drop-outs in the signal.
Gain hits: Changes in signal amplitude, indicating faults on the line or your modem.
Impulses: Static “pops” affecting the signal, like a TV or radio has static when it doesn’t have a clean connection to the signal source.
Dropouts: Detects gaps in the signal.
Attenuation & Delay table (relative to carrier frequency)
The large diagram in the centre of the report charts the average attenuation (or how much data is transmitted) at regular frequency intervals. The table also gives you an idea of average delay at certain frequencies.